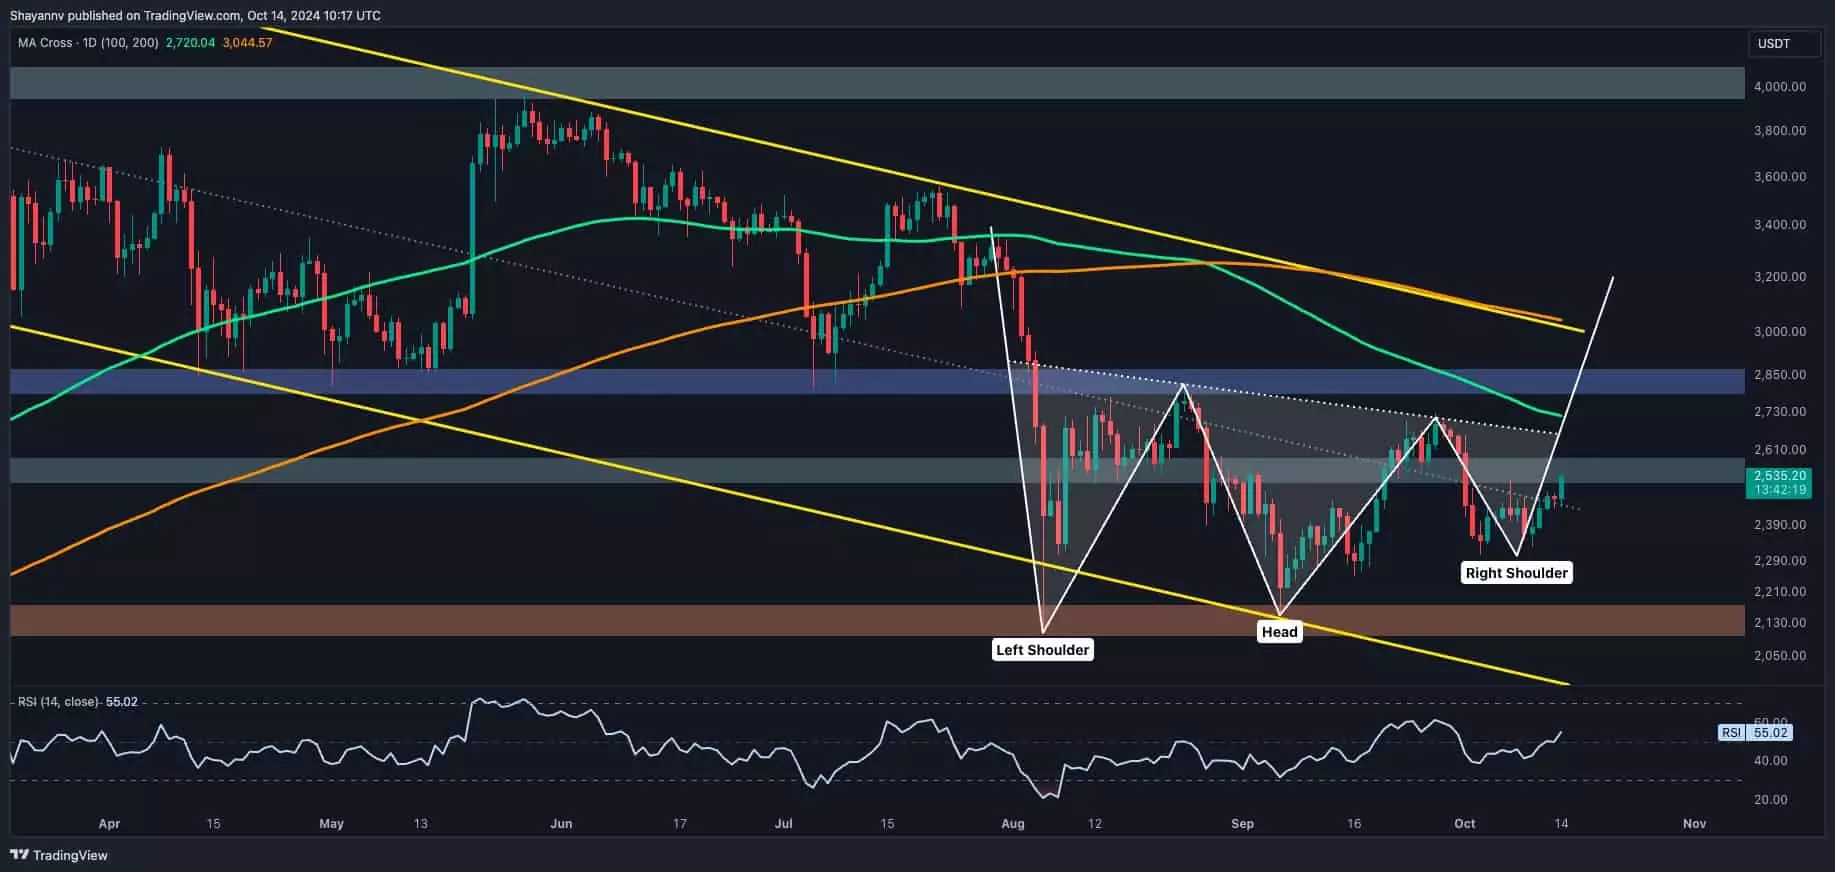
Ethereum, one of the most prominent players in the cryptocurrency space, is currently navigating a significant phase characterized by intricate patterns that may dictate its immediate future. As traders and analysts alike scrutinize the market for signals, the appearance of distinct technical formations has led many to speculate about potential bullish reversals. This article delves deeper into Ethereum’s recent price action, analyzing critical patterns such as the inverted head and shoulders, the double-bottom formation, and their implications for the near-term market trajectory.
At present, Ethereum is trapped within a consolidation phase, oscillating between $2.1K and $2.7K. The observed inverted head and shoulders pattern emerging on the daily chart serves as a hallmark of potential bullish momentum. This formation develops near the $2.1K support zone, where buyers have demonstrated resilience in maintaining upward pressure. As a typically bullish reversal signal, this pattern hints that a shift toward positive market sentiment may be in the offing, especially if Ethereum can breach the significant neckline at around $2.7K.
In conjunction with this, the four-hour chart presents a compelling double-bottom formation—a technical pattern often interpreted as a short-term bullish signal. The presence of these characteristic patterns paints a picture of cautious optimism for traders who are keenly observing Ethereum’s price action. The fundamental question then becomes: will these bullish indicators hold water amidst market volatility?
Ethereum’s market dynamic is intricately linked to certain critical price levels. The $2.1K support level stands as a pivotal point, delineating a zone where buyers have fortified their positions. Conversely, the $2.7K resistance level, acting as a neckline for the inverted head and shoulders pattern, signifies a decisive area that traders will closely monitor. A successful breakout above this resistance could signify a robust shift in momentum, potentially signaling a trend towards the $3K resistance zone.
Yet, how Ethereum reacts near these levels will be crucial. The $2.3K mark, forming a boundary of the ascending flag pattern, represents a key support area. As sellers appear to have difficulties pushing the price below this level, a clear breach could trigger a swift decline to the $2.1K support, a scenario that bears a reminder of the importance of maintaining close watch over these thresholds.
Moreover, a comprehensive examination of market sentiment reveals the role of liquidity zones—critical areas identified through analytics tools like the Binance liquidation heatmap. The dynamics of liquidity are especially telling: substantial stop-loss orders and liquidation levels clustered around the $2K support capture significant trader activity, particularly from institutional investors and market whales. This collective interest introduces an additional layer of complexity, as trader behavior in these liquidity zones can catalyze dramatic price movements.
Conversely, the liquidity concentrated at the $2.8K resistance not only represents a formidable barrier for upward momentum but also hints at a broader market sentiment that may resist price advances past this threshold. Should Ethereum manage to break beyond this point, a cascade of liquidations may subsequently launch, reinforcing the bullish trend. Conversely, faltering at these levels could incite a backlash.
As Ethereum’s price continues to be confined within this delicate balance, the prevailing sense of consolidation speaks to a broader equilibrium between buying and selling pressure. Traders must remain vigilant, prepared for either directional breakout or breakdown. Should bullish trends materialize, the implications could see Ethereum advancing rapidly toward $3K. Yet, it is equally plausible that a break below established support could catalyze a downward spiral.
Ethereum finds itself at a pivotal junction marked by nuanced technical patterns, critical support and resistance levels, and evolving market sentiment driven by liquidity dynamics. The forthcoming days will be crucial as these elements converge, potentially shaping the narrative for Ethereum in the months ahead. Investors and traders should remain alert to potential triggers that could herald significant price movements, underscoring the dynamic and often unpredictable nature of the cryptocurrency market.

