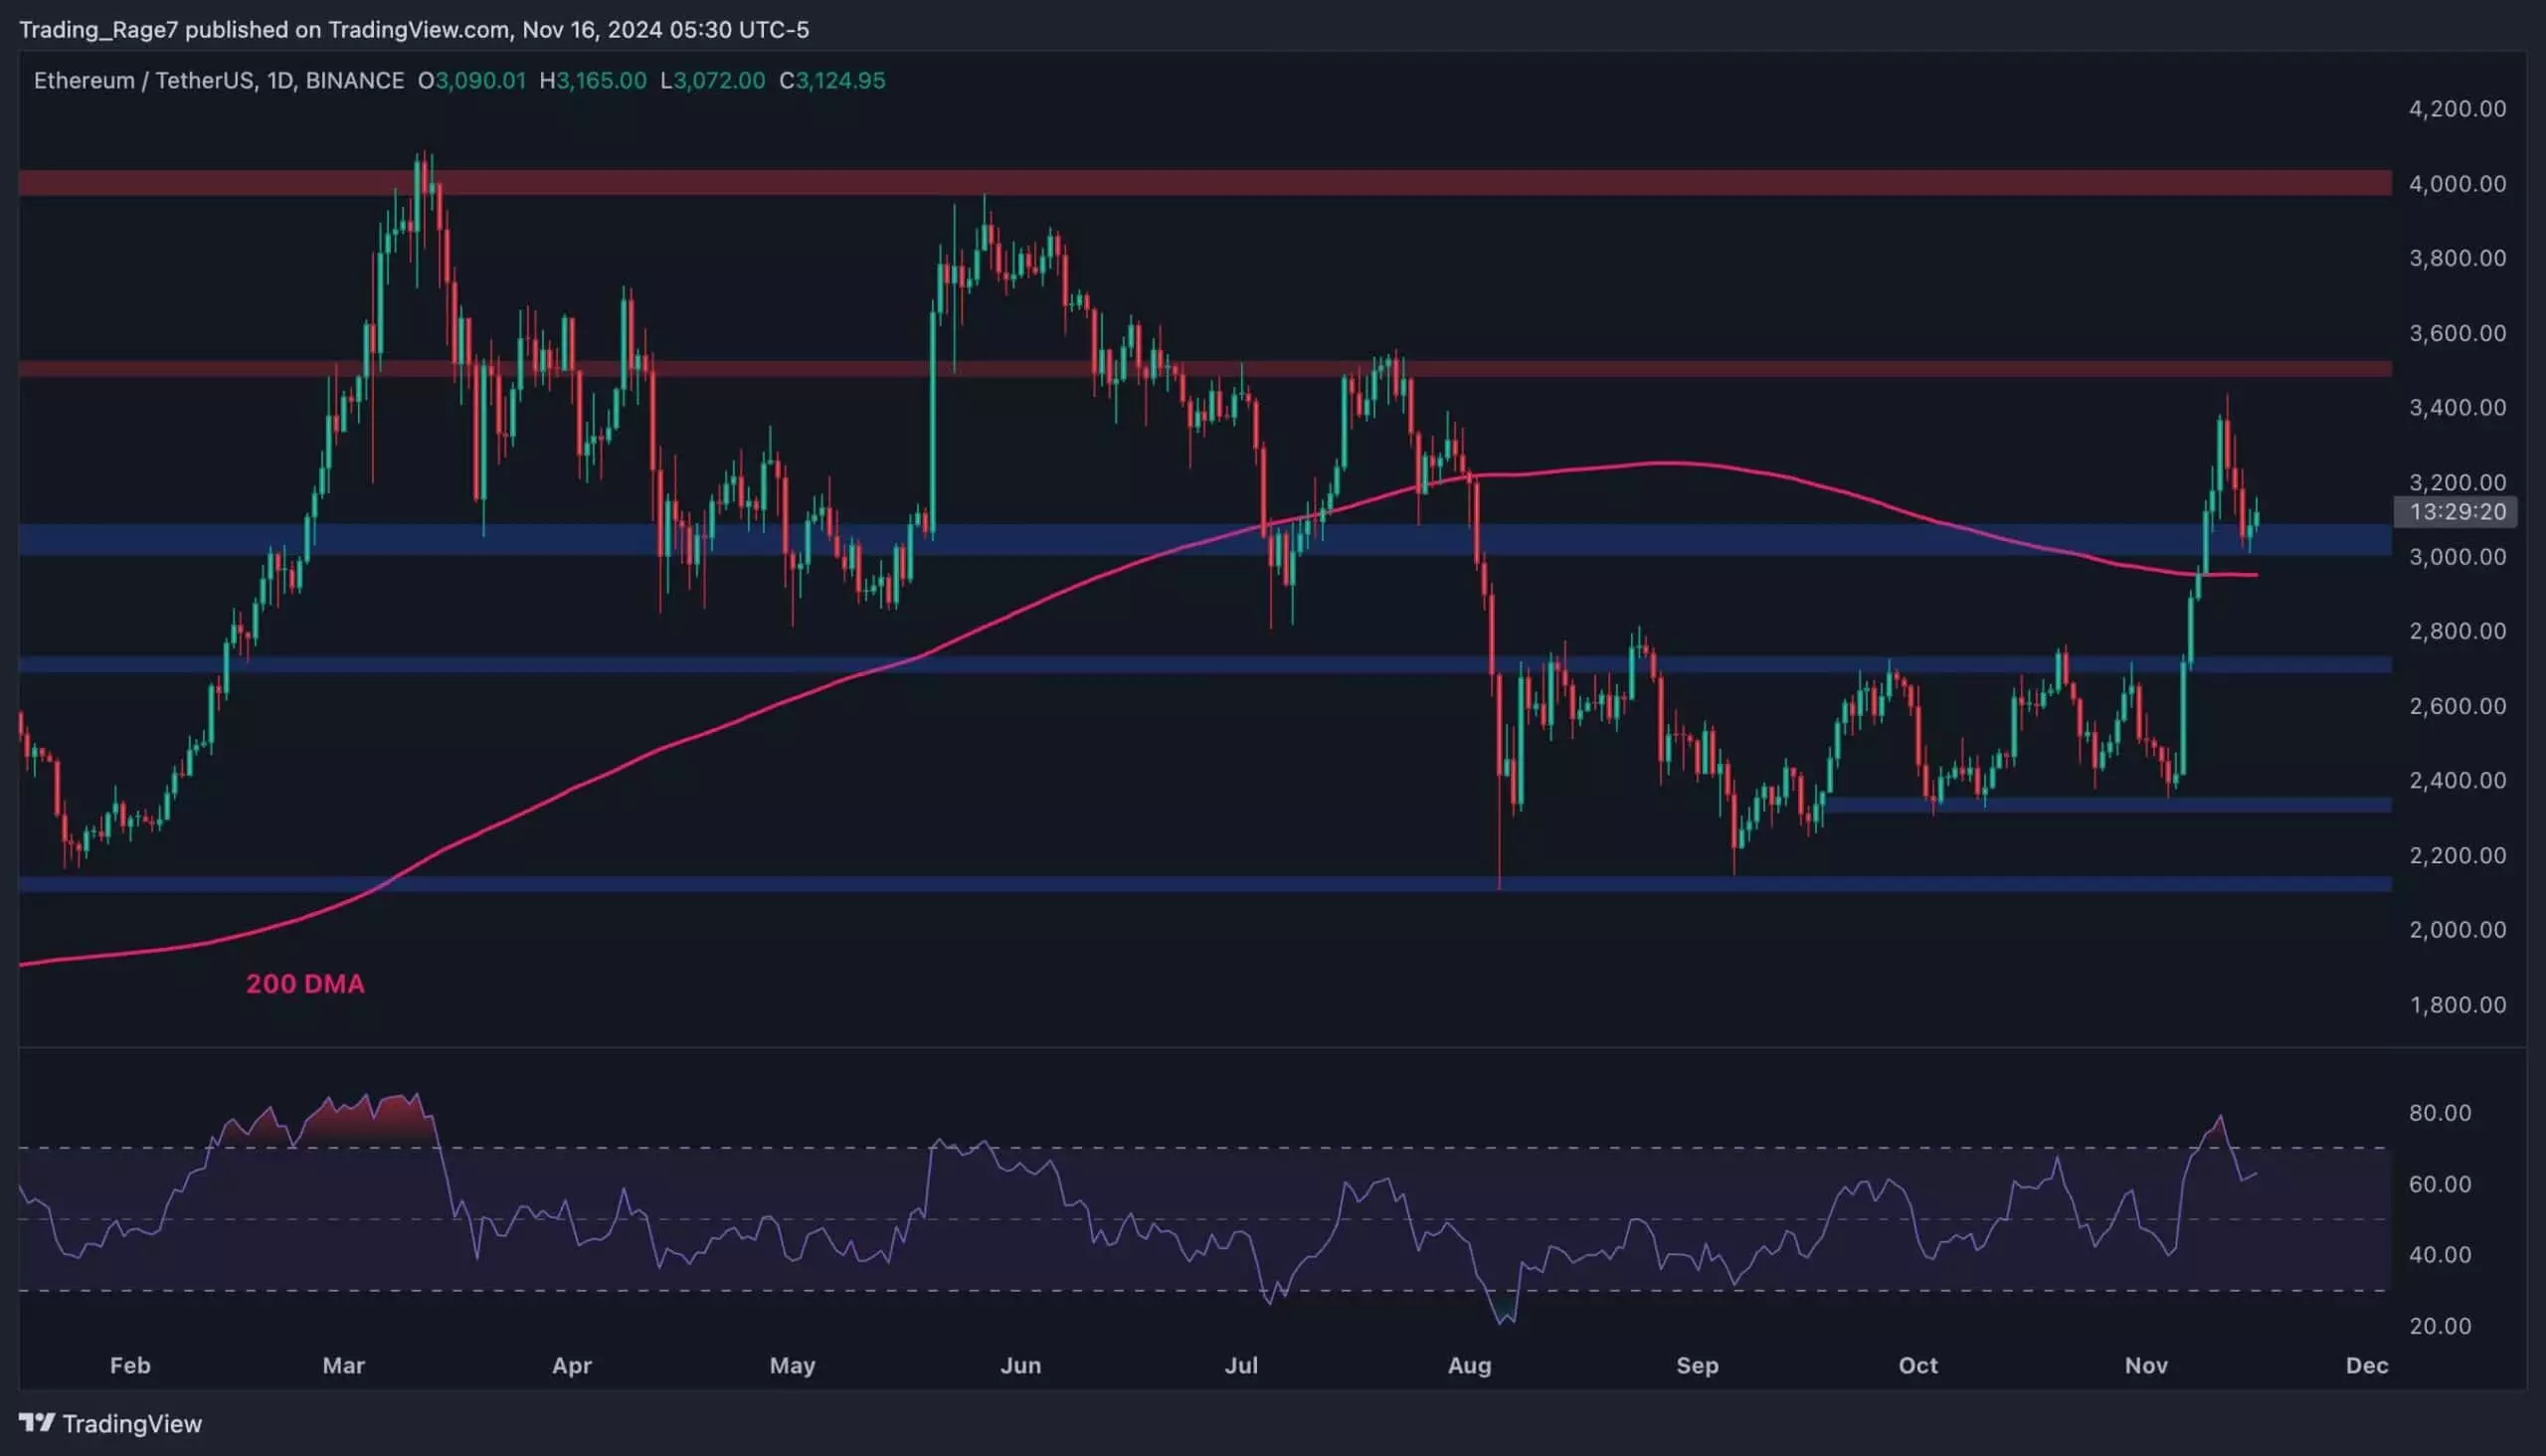
Ethereum, the second-largest cryptocurrency by market capitalization, is experiencing a resurgence, largely influenced by Bitcoin’s ascent to unprecedented price levels. After a prolonged period of stagnation, where the price struggled to maintain momentum, Ethereum is now showcasing a significant bullish breakout. Initially, Ethereum’s resistance at the $2,800 mark had proved challenging, but recent trading sessions indicate a bullish crossover that saw the price climb above both this resistance and the significant $3,000 threshold.
However, despite this positive trend, it is imperative to approach these developments with caution. The price has retreated toward the $3,000 level—a crucial support line—indicating potential volatility ahead. Historical trading patterns suggest that psychological support levels can act as a double-edged sword; while they may prevent further declines, they also present a battleground where bulls and bears clash, making trading decisions more precarious.
The 200-Day Moving Average: A Key Indicator
The inclusion of the 200-day moving average (SMA) adds another layer of analysis to Ethereum’s price action. This moving average serves as a vital indicator of overall market health. As ETH recently breached this moving average alongside the $3,000 resistance, market participants are keenly observing whether this level can sustain its support. If the price closes below this average, it may signal a lack of momentum, provoking a sell-off towards lower support levels, such as the $2,700 area.
Moreover, the Relative Strength Index (RSI)—a momentum oscillator that measures the speed and change of price movements—has entered an overbought condition. This typically foreshadows a market correction, suggesting that Ethereum may soon face increased selling pressure as investors take profits, especially given the recent highs.
Market Sentiment and Futures Activity
Interestingly, market sentiment appears mixed when considering futures trading data. The open interest for Ethereum futures has surged to levels not seen in years, fostering both excitement and trepidation among traders. Elevated open interest often signals impending volatility; however, it also raises concerns of a potential flash crash, especially if traders are overly leveraged in their positions.
This disparity between rising prices and increasing open interest presents a complex puzzle. On one hand, it could indicate that traders expect further upwards movement and market liquidity; on the other hand, it warns that excessive optimism may ultimately lead to sharp corrections if the market fails to extend its rally.
As Ethereum finds itself perched at a pivotal juncture, both bulls and bears must remain alert to ongoing market developments. The confluence of technical levels, including the $3,000 support and the 200-day moving average, alongside heightened futures activity, underscores the potential for both bullish advancement and bearish corrections. Investors are advised to monitor these technical indicators closely while considering broader market sentiments that could dictate Ethereum’s movement in the coming weeks. In a market as volatile as cryptocurrencies, where rapid shifts in sentiment can lead to drastic price changes, a tempered and strategic approach remains essential for navigating the complexities of Ethereum’s evolving landscape.

