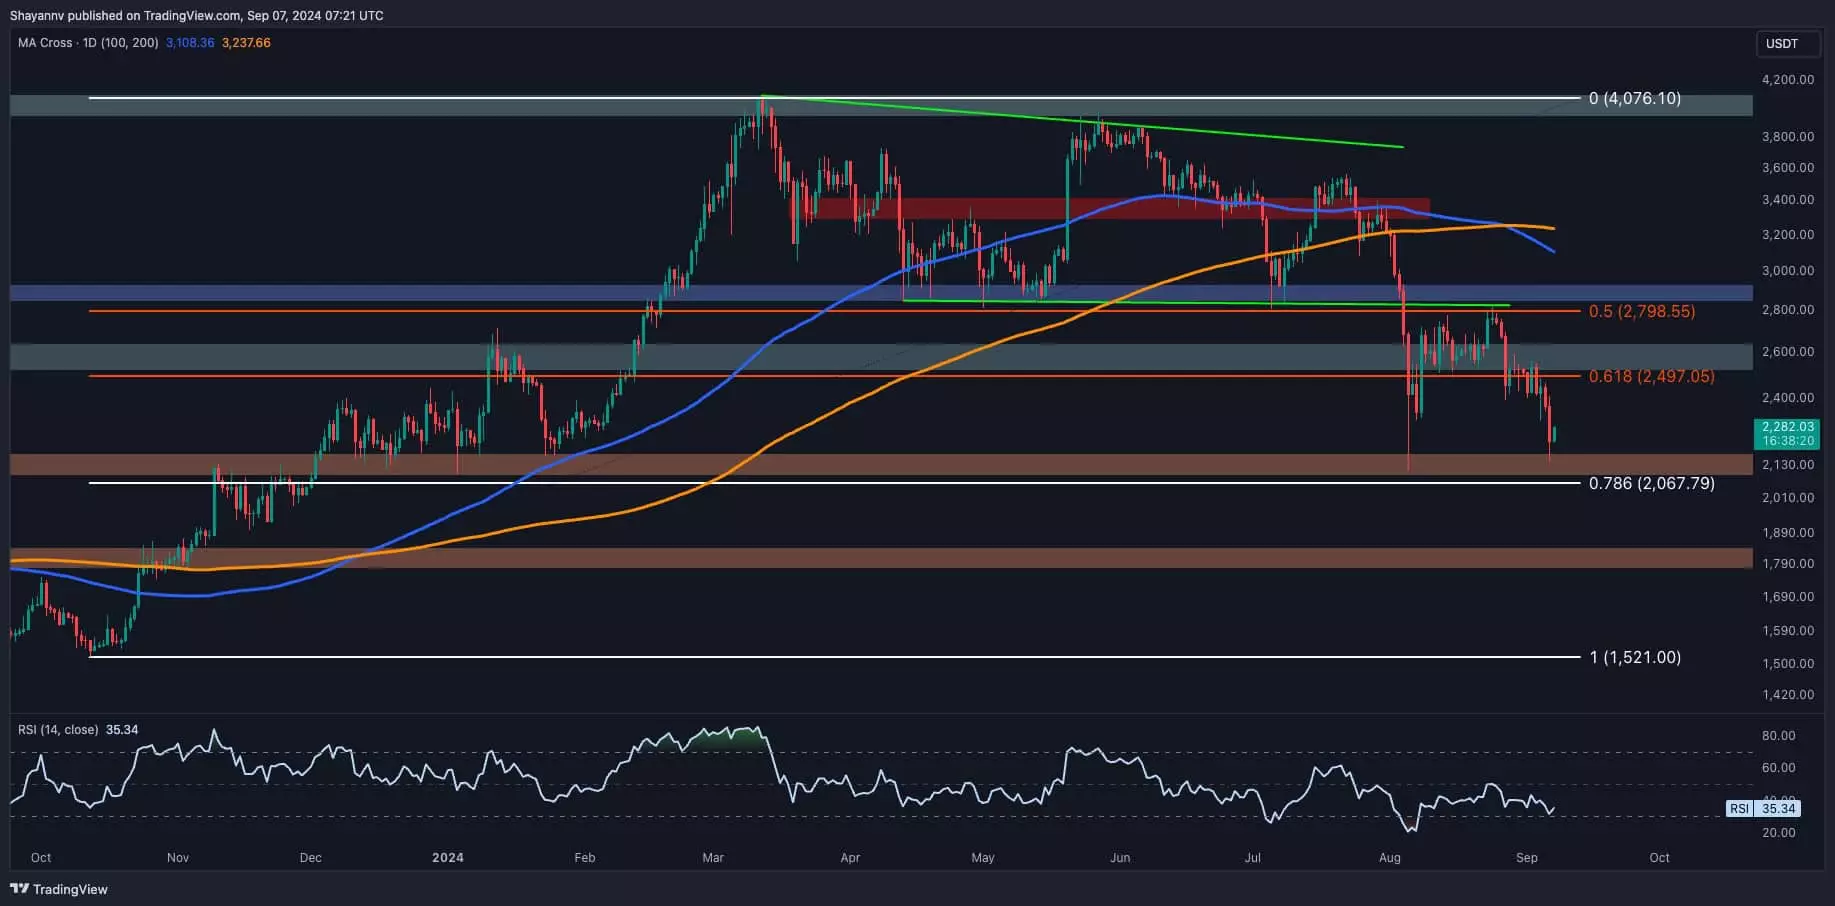
Ethereum’s recent performance has been lackluster, with a noticeable bearish trend dominating the market. Following a pullback to the lower boundary of a broken wedge pattern, coupled with the formation of a death cross, investor sentiment has been dampened. The lack of strong inflows into spot ETH ETFs has only served to underscore this negative sentiment, indicating a decrease in investor interest in Ethereum. The death cross, where the 100-day moving average dips below the 200-day moving average, is a significant bearish indicator. The rejection at key Fibonacci levels and the multi-month wedge boundary has further confirmed the strength of sellers in the market. Despite this, Ethereum is approaching a crucial support zone around the $2.1K level and the 0.786 Fibonacci retracement level at $2,067. This area is anticipated to attract significant demand, potentially leading to a temporary sideways consolidation phase before the next move for Ethereum is determined.
On the 4-hour chart, Ethereum has faced strong resistance between the 0.5 ($2.6K) and 0.618 ($2.7K) Fibonacci levels, resulting in continued bearish momentum towards the $2.1K support level. The $2.1K level has proven to be a strong support level in the past, particularly in early August, suggesting that buyers may step in at this price point to accumulate Ethereum. If demand materializes at $2.1K, Ethereum could experience a brief consolidation period, alleviating the downward pressure on the price. However, a breach of this critical support level could trigger a wave of long-liquidation events, potentially driving the price towards the $1.8K region. The upcoming days will be pivotal in determining whether Ethereum can hold the $2.1K support or if a more significant correction is impending.
Ethereum’s value is intrinsically linked to the vibrancy of its decentralized network and user engagement. One crucial metric for assessing this engagement is the number of unique active addresses on the Ethereum network. The 14-day moving average of Ethereum Active Addresses provides insight into the total number of distinct active addresses participating in ETH transactions. Since late March 2024, this metric has been on a downward trajectory, signaling a decline in user activity and transaction volumes. This downturn mirrors the prevailing bearish market sentiment, characterized by reduced demand and investor participation. To facilitate a potential recovery and sustainable rally, Ethereum needs to reverse this trend. A resurgence in the number of active addresses would signify renewed interest in Ethereum, fostering stronger demand and the possibility of a bullish reversal in the market.
Ethereum is currently facing significant challenges in the form of a bearish market trend, a critical support level test, and declining user engagement. However, the potential for a short-term consolidation phase and a recovery in active addresses present glimmers of hope for Ethereum’s future. The coming days will be crucial in determining whether Ethereum can weather the storm or if further correction is imminent.

